NOTE: An updated version of this article can be found in the Microsoft Maps Blog.
https://www.microsoft.com/en-us/maps/news/how-bing-maps-helped-vaccinate-the-usWith the pandemic raging across the world and a seemingly infinite supply of information coming from multiple sources about vaccine shipments, it was necessary to create a platform that could centralize information.
The Microsoft Bing team leveraged the full capabilities of the Bing Maps Platform to create a one-stop website for location mapping and visualizing critical information detailing worldwide cases, vaccine distribution plans, and vaccination deliveries.
To tackle the challenge, Microsoft Bing leveraged the versatility of the Bing Maps Web control to power the Bing Maps COVID-19 Tracker. This comprehensive tracker was built around the philosophy of promoting action by democratizing information through sharing of the Bing Maps COVID Tracker Data set.
Map-based tracking
Effective vaccination planning begins with valid and timely information for communicating critical details as a top priority. The COVID-19 tracker allowed visitors to find out everything they needed to know about the virus’s case distribution and vaccination plans of multiple countries at a glance. Drawing information from trusted sources like the CDC and WHO, the Bing Maps based COVID-19 tracker continues to update regularly and even supports drilling down into more granular data. This means that users today continue to have access to precise information at the county level.
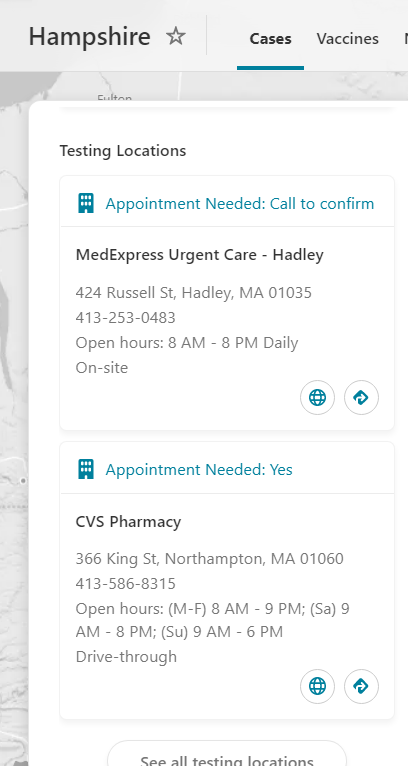
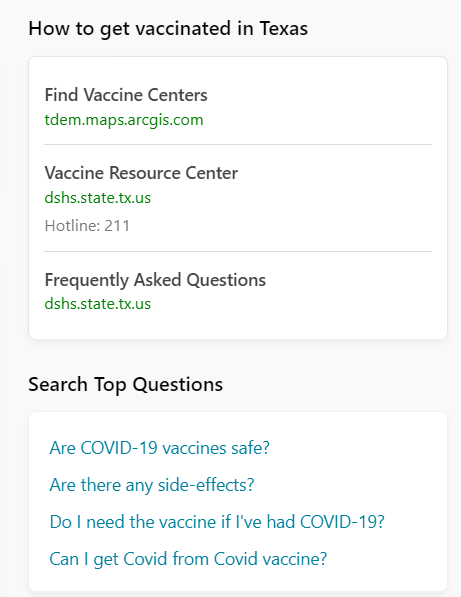
The team used Location Intelligence features like the Location Recognition API and Spatial Data Service Geodata API to add important region-based features to the tracker. For example, users living in Northampton could view the number of cases in their county and scroll down to find the nearest vaccination centers. The API also pulls the latest local news about vaccines including public distribution and shipment plans from trusted sources in a bid to reduce misinformation.

Data-driven vaccination
As vaccine availability varied dramatically across different countries it became increasingly important for the tracker to deliver accurate vaccine data. The Bing Maps COVID-19 Tracker was designed to collate the different types of available vaccines, whether RNA based or more traditional inactivated virus versions, and assign them to the countries in which they’re available. The tracker even displays the current status of the vaccines, including current trials and regulatory approvals.

Microsoft Bing relies on Bing Maps in all location driven experiences. It is therefore no surprise that Bing Maps was leveraged to achieve the goal of providing aggregated COVID-19 and vaccination information from trusted data providers in an easy-to-navigate web experience.
The Location APIs were used to identify the distribution locations of planned state-wide vaccination centers and vaccine shipments. Similarly, Bing Maps also helped businesses meet demand surges during the pandemic with predictive traffic, Bing Maps Web SDK created a more personalized mapping platform to support finding not just vaccinations but other needed resources as well.

Visualizing vaccinations
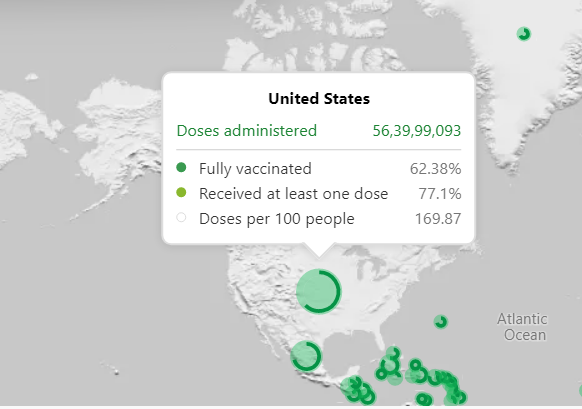
For ease of use, the Bing Maps team used AnimatedTileLayer events to visualize vaccination and current case data for each state. The AnimatedTileLayer class allows developers to create dynamic map tiles that update at designated intervals, accompanied by an animation. For the COVID-19 tracker, this consisted of variable red circles to represent regional virality and green circles at varying levels of completion to represent the vaccination distribution in a particular area.
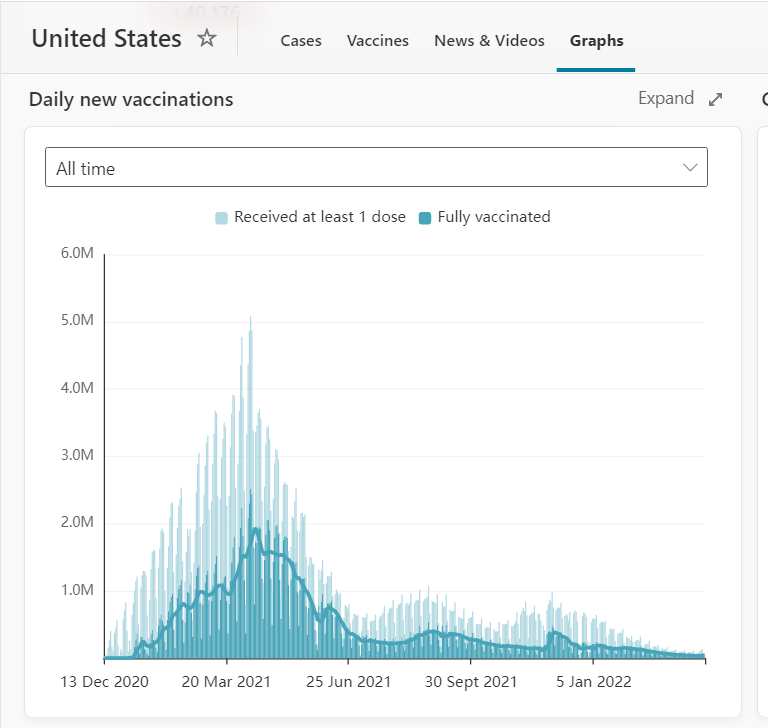
For maximum effectiveness, the COVID-19 tracker needed to automate data visualization and create up-to-date graphs for any region selected by the user. Bing Maps API’s native integration with other Windows apps, particularly Power BI and Excel, was instrumental in delivering customizable vaccination graphs.

Power BI with Bing Maps integration lets developers use existing data sets to create visualizations out of reports. Using the tracker, visitors can look at both cumulative and daily vaccinations at the national level. Thanks to high data granularity, users can plan ahead with vaccine distribution statistics at the state-level.
To create such a robust tracker with multiple features, the team needed a kit that could support extensive web development while still keeping the website lightweight. The answer was V8 Web Control, a developer kit that enables web development for a variety of browsers and contains useful map controls like Spatial Data Services.
Powered by HTML5, V8 Web Control provided the foundation for critical tracker features like AnimatedTileLayers and customizable map styles. The team was able to use it to make the tracker functional on mobile and desktop devices, delivering fast load times despite the massive amount of vaccination and case data involved.
Visualizing the future
Microsoft Bing continues providing up-to-date and accurate news promoting effective public health policy through vaccine delivery efforts as well as supporting better personal health decisions. By offering the ability to find out if the current COVID-19 status is in their county, the tracker empowered people to isolate effectively.
Bing Maps API provided the foundation for this informative planning platform that aided in the analysis of distribution of vaccinated people across the country and The Bing Maps platform’s comprehensive set of location aware APIs and multiple SDKs is available for your projects as well. Enterprises and individual developers can create similarly scalable mapping experiences using Bing Maps by just creating a key to get started.

