NOTE: An updated version of this article can be found in the Microsoft Maps Blog.
https://www.microsoft.com/en-us/maps/news/optimizing-supply-chains-for-better-customer-experienceSimple supply chain logistics have become a thing of the past. Even smaller businesses manufacturing relatively basic products have to work with several different suppliers located thousands of miles away from each other. Manually processing all that data and figuring out how your business can improve its supply chain is a massive challenge. Let’s have a look at how Bing Maps API can help.
Leveraging CRM data
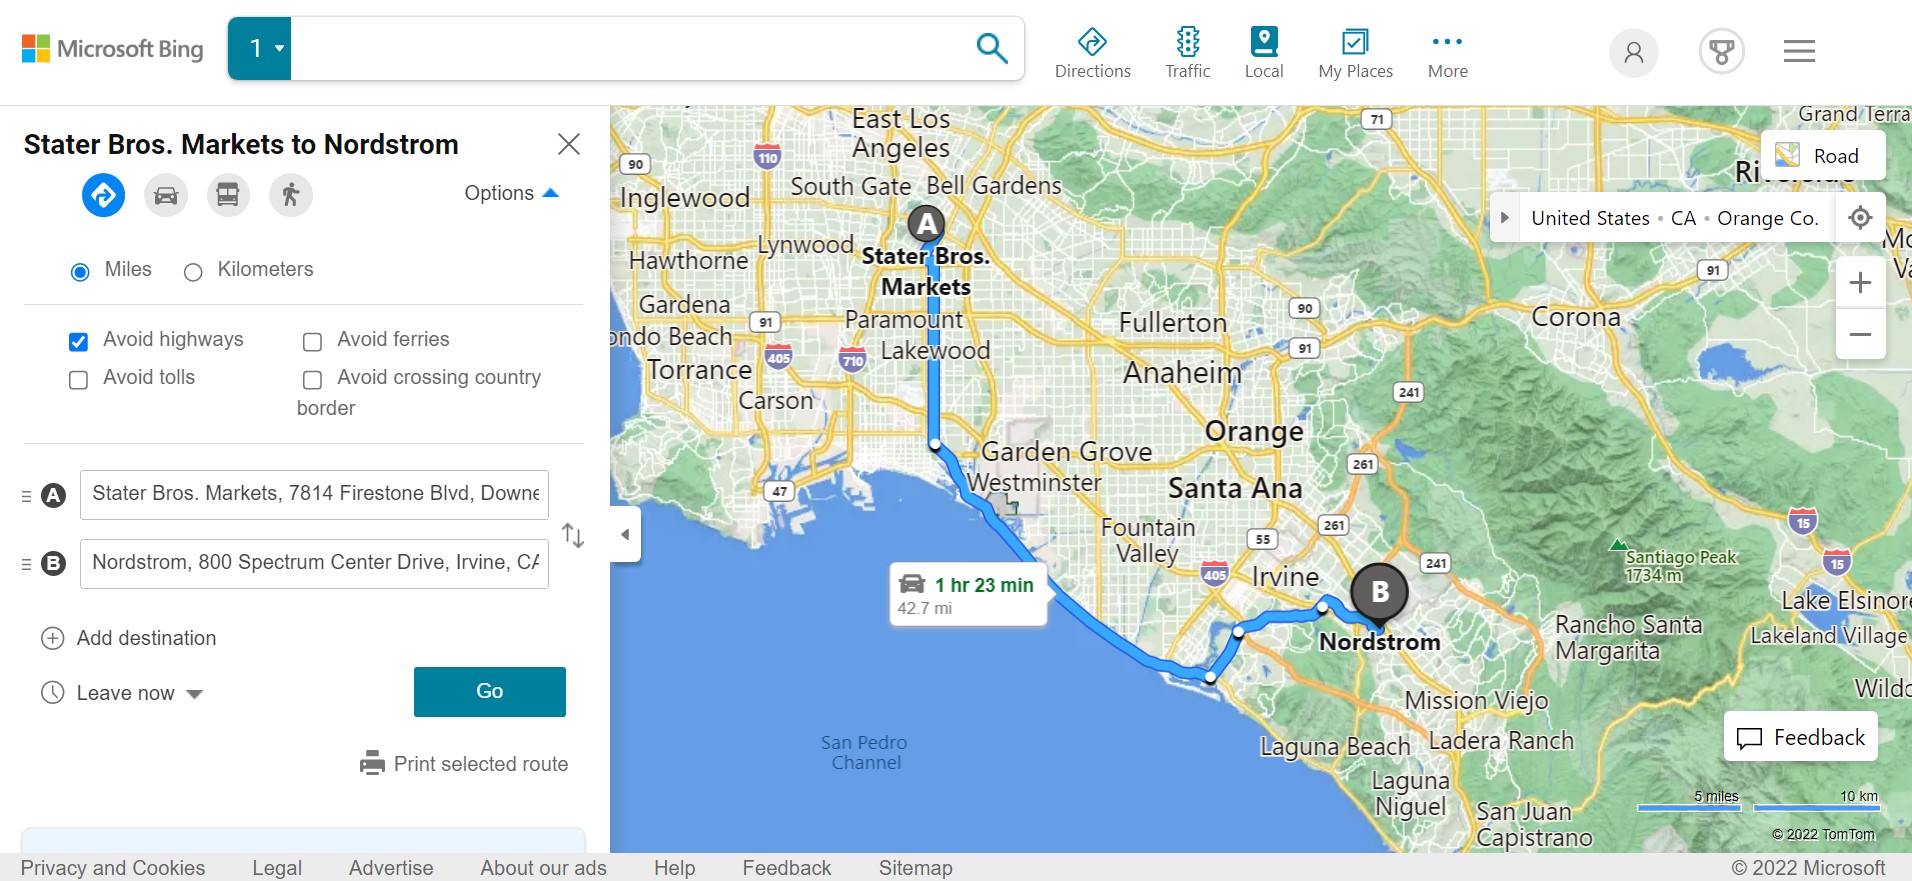
There’s a lot more to Bing Maps API than just high-resolution mapping and route optimization. Under the hood, you’ll also find support for customer relationship management (CRM) data. By using Bing Maps API to visualize this CRM data, businesses can accurately map both consumer behavior trends and their entire supply chain logistics from start to finish. This includes routes with frequent delays and other inefficiencies.

Let’s say a business is looking to scale up and serve a larger number of customers in their area, but repeated delays from a supplier are causing them to lose money and prolong the expansion. Improving supply chains starts with better data management. The operator should keep track of agent departure and arrival times to and from the supplier's location, as well as the routes they took for each journey using an Office app like Excel.
Bing Maps API’s integration with Power BI and the Office suite allows you to seamlessly transfer and map supply chain logistics data, overlaying the various routes taken by the agent. Once you’ve spotted the vulnerabilities, you can start working on an optimized route.
Visualizing Supply Chains
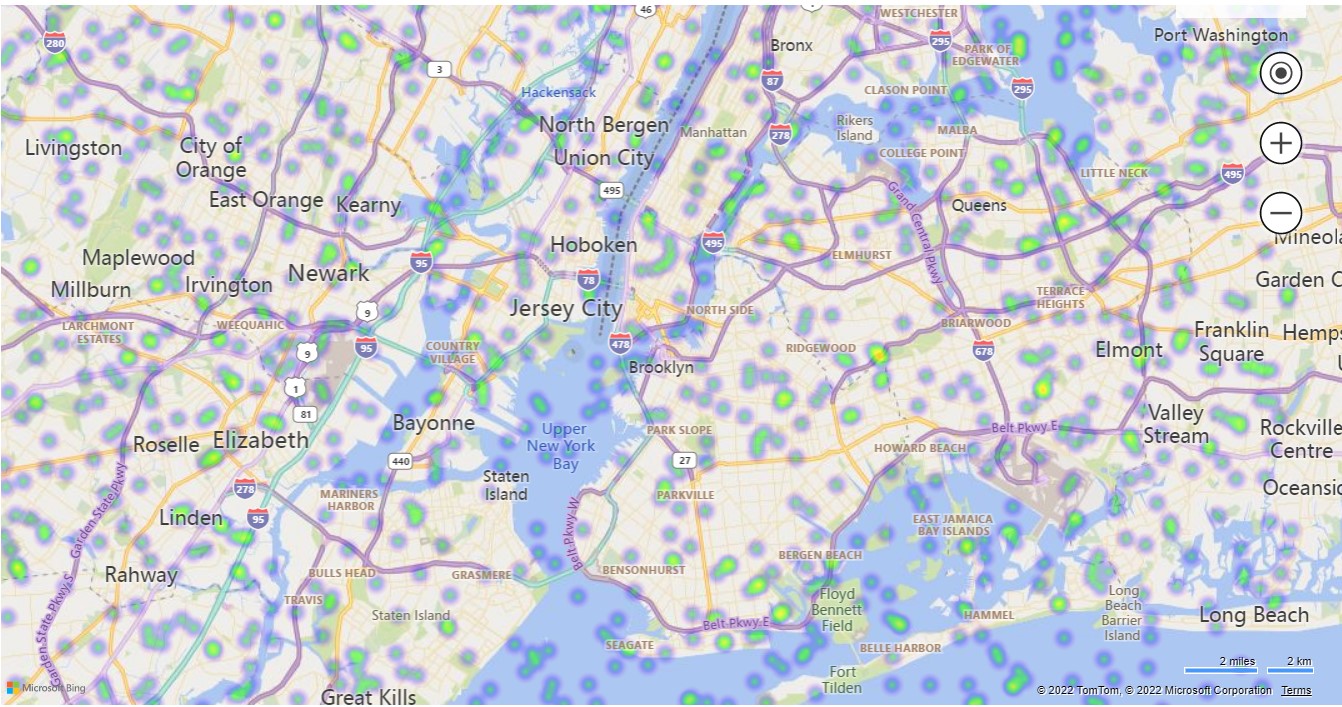
Visualizing data is rarely as linear as plotting a path from points A to B. When analyzing supply chains and consumer trends, we often have to turn to dynamic visualizations like heat maps. If you’ve already imported a CRM data set, overlaying a heat map takes minutes.

The Bing Maps V8 Web Control comes with a set of powerful features for your web applications. These map controls include must-have concepts like interactive pushpins, infoboxes, and a heat map module that can be overlaid on a generated map to reflect data density. Let’s have a look at how easy it is to create a heat map to improve supply chain logistics with the sample below.
<!DOCTYPE html>
<html>
<head>
    <title></title>
    <meta charset="utf-8" />
    <script type='text/javascript'>
    function GetMap() {
        var map = new Microsoft.Maps.Map('#myMap', {
            credentials: ‘Your Bing Maps Key’,
            mapTypeId: Microsoft.Maps.MapTypeId.aerial,
            center: new Microsoft.Maps.Location(39.5, -98.4),
            zoom: 4
        });
        //Generate a 50,000 random locations that are within the bounds of the map view.
        var locs = Microsoft.Maps.TestDataGenerator.getLocations(1000, map.getBounds());

        //Load the HeatMap module.
        Microsoft.Maps.loadModule('Microsoft.Maps.HeatMap', function () {
            var heatmap = new Microsoft.Maps.HeatMapLayer(locs, {
                intensity: 0.65,
                radius: 100000,
                unit: 'meters',
                colorGradient: {
                    '0': 'Black',
                    '0.4': 'Purple',
                    '0.6': 'Red',
                    '0.8': 'Yellow',
                    '1': 'White'
                }
            });
            map.layers.insert(heatmap);
        });
    }
    </script>
    <script type='text/javascript' src='http://www.bing.com/api/maps/mapcontrol?callback=GetMap' async defer></script>
</head>
<body>
    <div id="myMap" style="position:relative;width:600px;height:400px;"></div>
</body>
</html>
As you can see from the sample, heat maps are completely customizable. You can tweak everything from color gradients to intensity and heat map radius to meet internal brand guidelines and improve usability. This sample generates random hotspots but you can, of course, import your own logistics data in GeoJson format to map your supply chain.
Learn more by checking out the interactive heat map code sample on the Bing Maps API portal.
Asset management
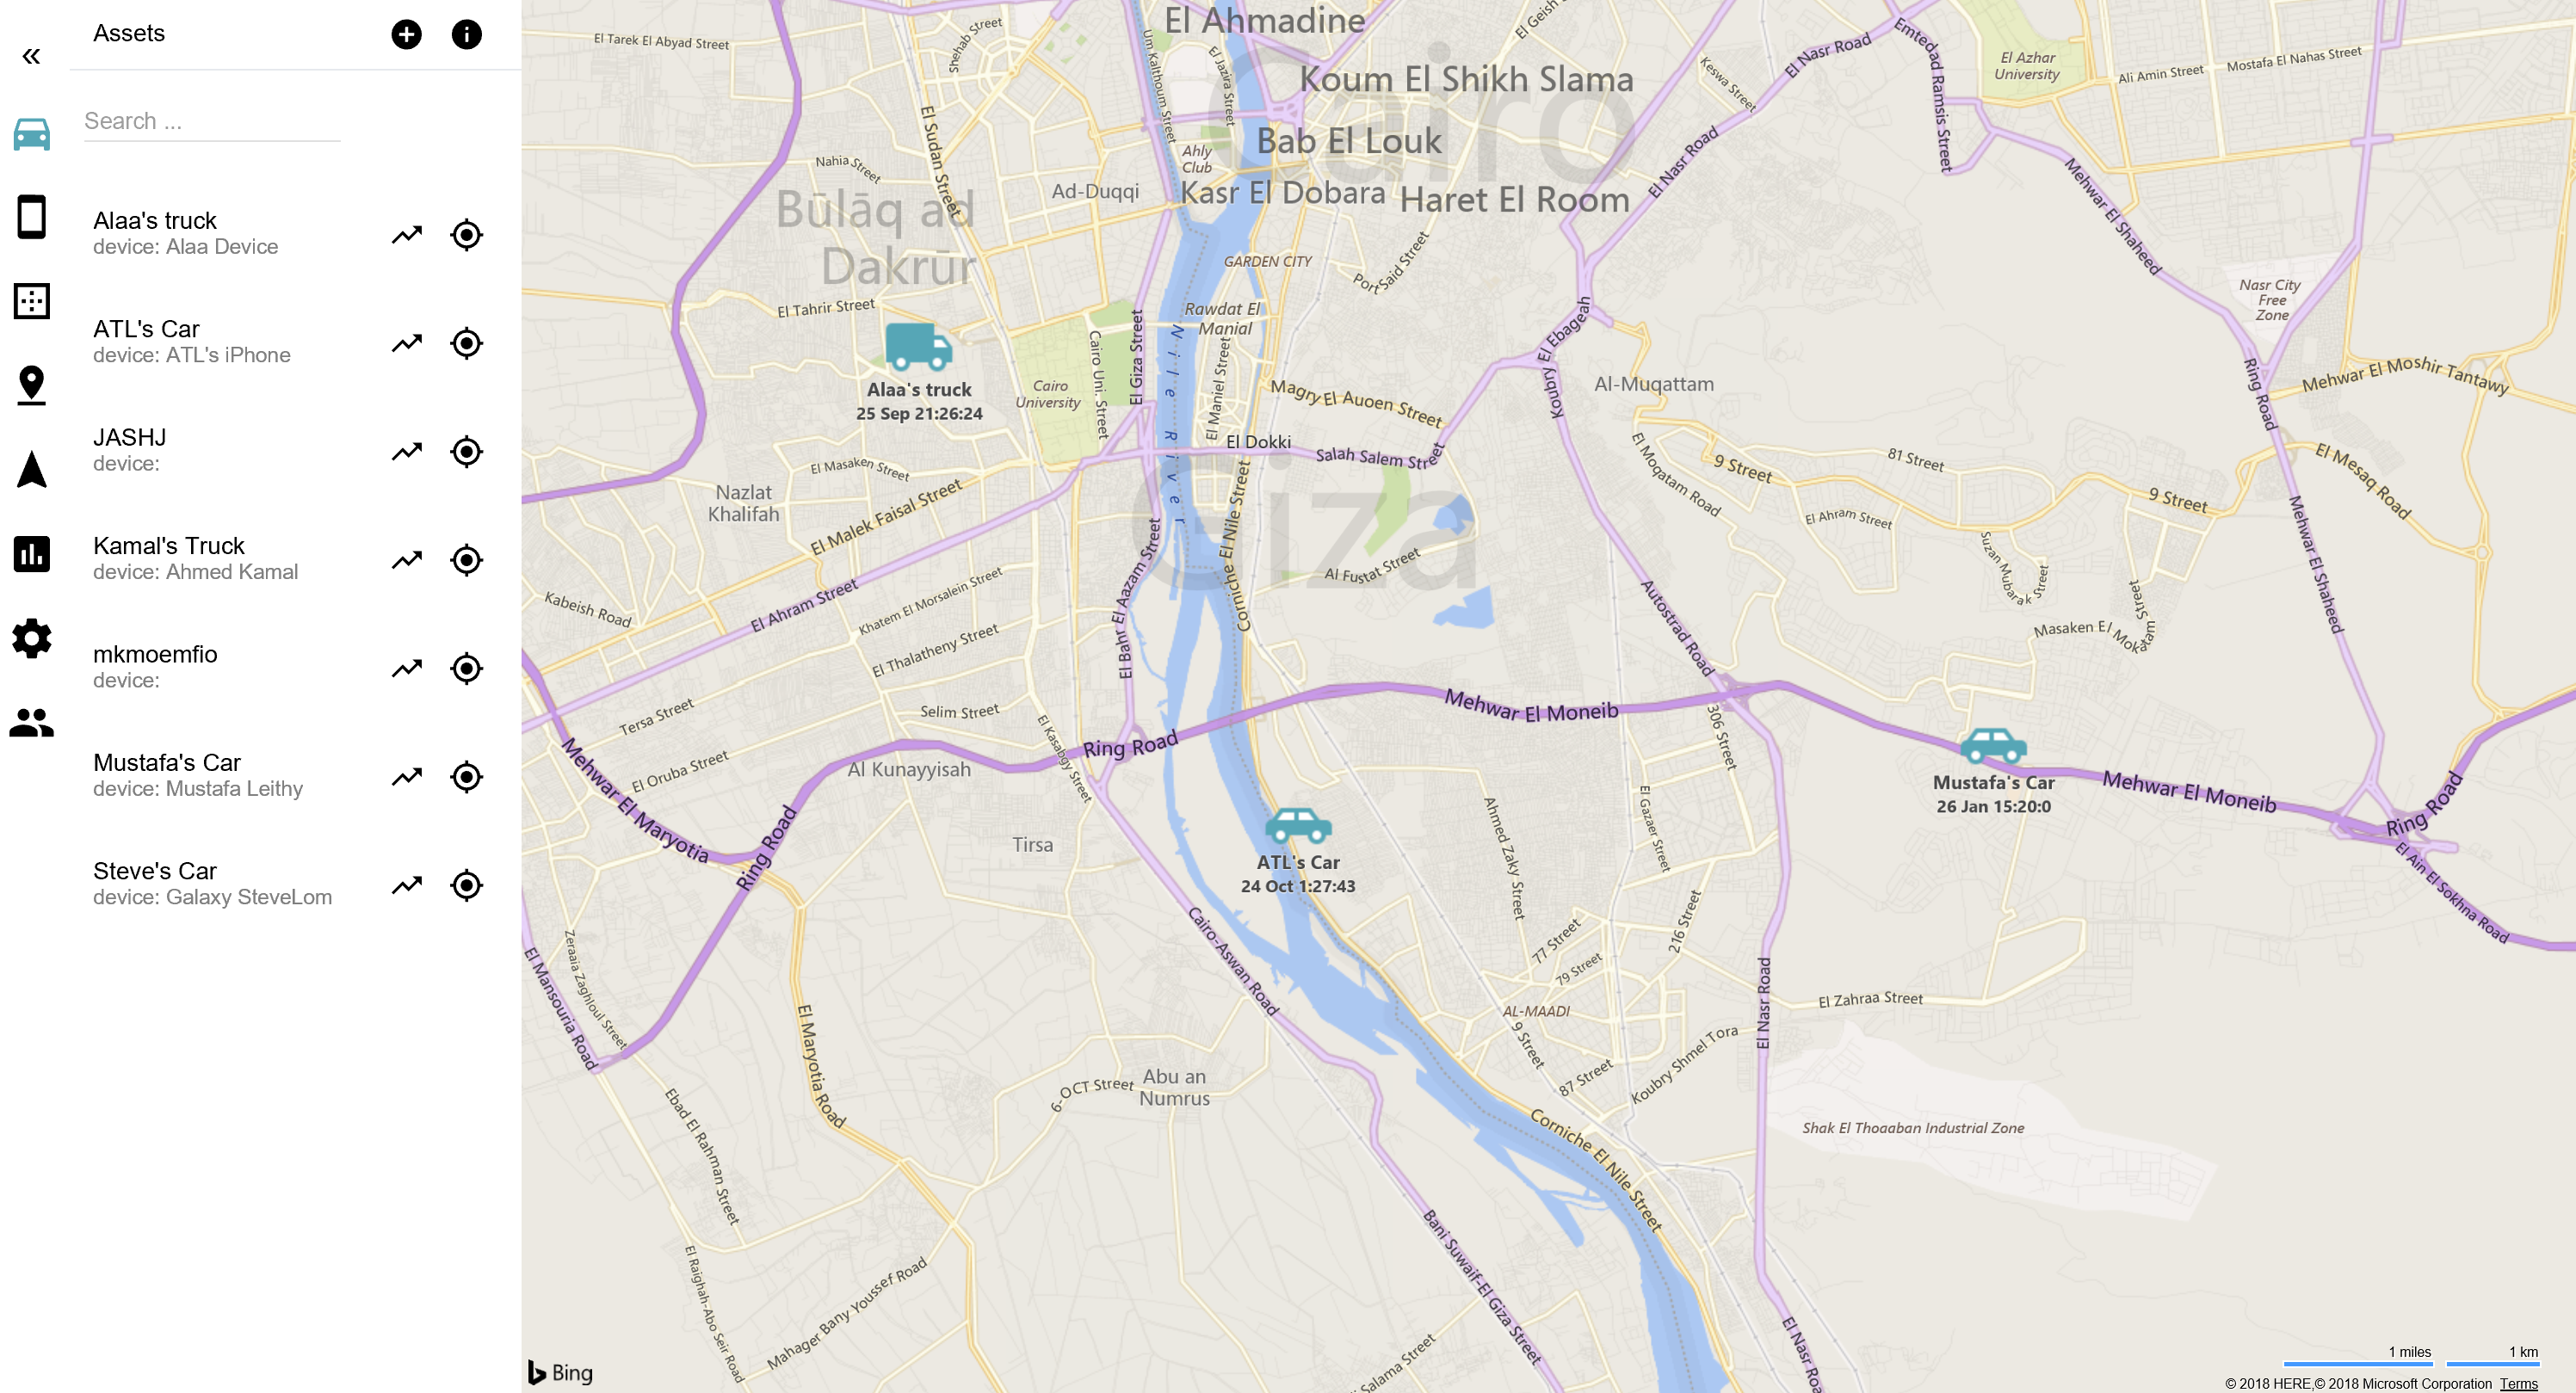
Planning can only take you so far when it comes to improving inefficient supply chains. The other half of the puzzle Involves real-time asset management to give operators the power to monitor each part of the supply chain. The Fleet Tracker API is a great place to start, ideal for small to medium-sized fleets.
Without a fleet management solution, managers will send out a few agents to deliver or retrieve materials at set times, with no way of tracking where an agent is during the journey. Drivers will often run into road closures or take congested routes, driving up logistics costs and potentially creating supply chain delays.
Operators can use Fleet Tracker API features like geofencing and trip detection to register alerts when a vehicle enters or leaves a designated zone. This creates accountability and improves the customer experience by giving them a more accurate estimate of delivery times.

Businesses that don’t have a supply chain or a logistics app set up yet can build an optimized one from scratch with the Multi-Itinerary Optimization API. Use the API to identify which agents would be best suited to deliver to certain depots depending on their starting locations and shift schedules. The real strength of this API comes from its immense scalability, with support for up to 200 agents at a time.
An improved supply chain naturally translates to a better customer experience. Integrate your CRM database with Bing Maps API to let your customers know exactly when they can expect to receive their deliverables, and fine-tune agent tracking and routing to reduce those delivery times.
Start today
Effective supply chain logistics rely on business intelligence. Boost yours with a mapping API that can understand your unique logistical needs and adapts to meet them. Creating a basic Bing Maps API key is free and takes minutes, get yours today.
FAQ
Are there other APIs that can improve supply chains?
This blog only covers a few of the many APIs that can optimize your supply chain. For example, you can calculate specialized routes for commercial vehicles with the Truck Routing API, or, visualize the area a truck can cover in a given time limit with the Isochrone API. Learn more by visiting our logistics page.
I’ve never built a logistics app for supply chains before, how much experience do I need to use these APIs?
Building powerful mapping solutions is easy with Bing Maps API, whether you’re just starting or you’re a seasoned developer. You can rely on our library of interactive code samples and other developer resources for support as you build your app.

