
NOTE: An updated version of this article can be found in the Microsoft Maps Blog.
https://www.microsoft.com/en-us/maps/news/case-study-how-to-use-distance-matrix-api-for-commute-analysis-and-office-site-planningBing Maps Distance Matrix API helps customers solve a broad range of business problems related to travel routes and times, for example, local data analysis, vehicle asset management, delivery routing optimization services, travelling salesman problem, real estate site planning, sorting in job search sites, commute time calculations, commute options planning, and more.
Recently, a Real Estate and Facilities (RE&F) team with a Microsoft subsidiary used Bing Maps Distance Matrix API, as the specialty tool to perform a quick commute analysis. Commute time map analysis using the Bing Maps API helped the team identify the single best location for collocating all of their operations from multiple offices in a metro area (hereafter referred to as “Region X”) to one office location.
“As we were in process of collocating a new site, finding the right location for our colleagues was essential. We wanted to make it more accessible and to have a better commute for all our staff. Using the Bing Maps Distance Matrix API, we were able to quickly determine with HIGH ACCURACY where they live, what is the commute time currently, and what will be the commute time to the proposed locations. GREAT HELP in narrowing the options. Therefore, GREAT TOOL with GREAT RESULTS,” said RE&F team Facilities Operations Manager.
In this blog post we share in detail how the RE&F team used the Bing Maps Distance Matrix API as a commute time calculator to make the best decision possible for their organization and their employees.
Business problem
The Microsoft subsidiary is expanding into Region X with a plan to renovate their buildings and facilities. Their RE&F team investigated available options in the real estate market to collocate all operations from multiple locations within the target region into a single location, but they are having a hard time deciding upon a location.
Various factors and calculations are being considered with one of the most critical being employee commute time. The RE&F team wants to make sure that they factor in how much time each employee spends commuting via public transportation or vehicle and map out a site that would be most easily accessible (for all the employees).
A commute study was needed to investigate how employees could decrease their average commuting time. Yet given the large number of the employees and candidate sites, analyzing the various combinations of commute scenarios was a challenge.
The study outlined below illustrates how the RE&F team met the challenge, calculated and analyzed commute times, taking into consideration the multiple current office locations situated in different areas of Region X versus the potential future office locations.
Analysis and solution using Distance Matrix API
The Bing Maps Distance Matrix API proved to be the perfect tool for RE&F team’s commute study. They first needed to understand where within Region X their employees are living. After running some HR reports, the RE&F team discovered that a large portion of the employees reside in cities outside of Region X. Additionally, each employee completed an anonymous survey collecting details about the street name and street number of their residence in addition to the site where they work.
Using Bing Maps Distance Matrix API, the RE&F team was able to calculate the average commute time spent in traffic from each employee’s home address to the office. They then calculated the average difference in travel time during rush hours.
With all of this data in hand, using Distance Matrix API, the team quickly calculated the average time spent in traffic by all the employees commuting to their current locations compared with the average time that would be spent in traffic travelling to the new sites. This data made mapping commute times an easy task!
The results were then analyzed with and mapped on the site locationsto identify the best location based on ease of access. An example table of the average commute time delta comparing all candidate sites is illustrated below:
Table 1. Average employee commute time to each site vs. average of all sites
|
Site # |
Average commute time delta (minutes) |
|
1 |
- 18 |
|
2 |
- 11 |
|
3 |
- 8 |
|
… |
… |
|
X |
+ 19 |
|
… |
… |
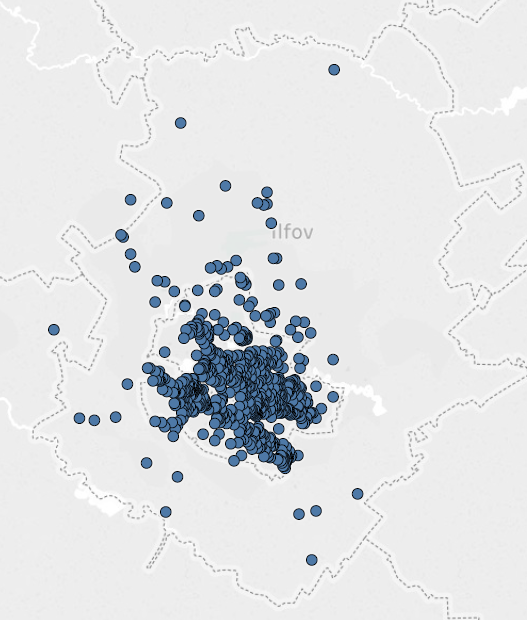
Figure 1. Illustration of employees’ commute analysis to multiple locations using Distance Matrix. (Note: Blue dots show the distribution of employee home locations)
The table above demonstrates a simplified approach to solving the problem by comparing average commute times. Subsequently mapping commute time reults from the distance matrix provided a further simplified visual representation to ease decision making. In this instance Site# 1 would be the best location because it has the shortest average commute time. However, the RE&F team went a step further and took the impact of employee distribution into account, by analyzing and modeling each employee’s commute time. Bing Maps Distance Matrix API powered the calculations based on road data and commute routes with location intelligence features like real-time traffic data.
After that, the RE&F team broke down the potential impact of each new site on commute time into three levels, with respect to each employee’s current office location:
1. New commute time that would be shorter due to potential relocation [This is a benefit]
2. New commute time that would increase but by less than 30 minutes [This has a mild negative impact]
3. New commute time that would increase by more than 30 minutes [This is a high-risk choice]
The table below summarizes the percentage of affected employees in each of the three impact levels.
Table 2. Key findings in driving mode using Distance Matrix API
|
Candidate Site |
% of employees [new commute time is shorter] |
% of employees [new commute time increases but by less than 30mins] |
% of employees [new commute time increases by more than 30min] |
|
1 |
60% |
40% |
0% |
|
2 |
70% |
30% |
0% |
|
3 |
47% |
53% |
|
|
4 |
51% |
47% |
2% |
|
… |
… |
… |
… |
|
X |
… |
… |
… |
Distance Matrix API supported commute time calculations and analysis for both driving and public transportation, including useful location data such as historical traffic impact for diferent and alternate routes.
In the driving case, take Table 2 as an example, candidate Site# 2 would be the overall winner in terms of positive impact: the highest percentage (70%) of employees will benefit from a shorter commute. That said, all candidate sites are fair choices with mild increases in commute time of less than 30 minutes. According to the matrix, only 0% - 2% of employees will see more than a 30-minute commute time increase.
Table 3. Key Findings in public transport (i.e. transit) mode using Distance Matrix API
|
Candidate sites |
% of employees [new commute time equal or shorter] |
% of employees [new commute time increases but by less than 30mins] |
% of employees [new commute time increases by more than 30min] |
|
1 |
45% |
38% |
17% |
|
2 |
57% |
35% |
8% |
|
3 |
22% |
68% |
9% |
|
4 |
69% |
19% |
12% |
|
… |
… |
… |
… |
|
X |
… |
… |
… |
As for the public transportation case, take Table 3 as an example. Candidate Site# 4 would be the overall winner in terms of positive impact: the highest percentage (69%) of employees will benefit from a shorter commute. Candidate Site# 2 is also a fair choice, as it benefits 57% of employees while having lowest percentages of employees who will see more than a 30-minute commute time increase.
In contrast, candidate Site# 1 would have the highest percentage (17%) of employees that run a high risk of a commute time increase over 30 minutes. In summary, candidate Site# 4 and candidate Site# 2 would be fair options.
As illustrated in the examples of the analysis above, the Bing Maps Distance Matrix API ultimately helped the RE&F team analyze commute time calculations to make the best decision in selecting a future office site.
Optimizing commutes for job seekers
The Distance Matrix API is just one tool to use as a commute time calculator. If you’d like another example of how our intuitive optimizations led to big changes, check out the LinkedIn customer story. The LinkedIn team used the Isochrone API to deliver an optimized user experience for job seekers, taking into account possible commute times and predictive traffic.
Whether you’re consolidating your business operations, optimizing routes for multiple delivery agents, or finding the perfect spot for a branch office expansion, there’s a Bing Maps API feature perfect for your needs. Create your free key and scale up your business with intelligent mapping.
To get more information, data, and examples of the Distance Matrix API in action, see the documentation and visit www.microsoft.com/maps.
For any questions about other Bing Maps API use cases and how to license Bing Maps for your solution, contact the Bing Maps Licensing team at maplic@microsoft.com.