
Most enterprise data have a location component, and data related to customer support interactions are no exception. When interacting with a customer, knowing where they are physically located can enable us to provide them with location-specific insight and information. Further, by visualizing larger groupings of customers, interactions, or social media events on a map, we can identify trends by location, and use these location-based trends to optimize our customer care approach and behaviors. In this blog post, we will show you how you can spatially enable your approach to customer care by integrating Bing Maps into Parature, a cloud-hosted multi-channel customer service software from Microsoft.
A Brief Introduction to Parature
Parature offers customer service software that integrates a customer portal, intuitive self-service knowledgebase, a help desk ticketing application, and a host of robust business modules into a central, customizable, web-based system. In this post, we will focus on the ability for customers to submit location-enabled tickets through a customer portal, and for Customer Service Representatives (CSRs) to then use the Parature Service Desk to visualize ticket locations on maps, both individually, and via heat maps.
Prerequisites:
- A Bing Maps developer account and key
- A Parature sandbox; if you are not a Parature customer, you can engage with the Parature team to learn more
- Parature Service Desk credentials to enable us to log in as an Account Administrator, with the ability to customize ticket fields, the Service Desk, and the Portal
Capturing Location Information for Customer Tickets
In order to capture and persist location information about support tickets raised by customers, we need a way to store location information for tickets. Depending on your specific scenario, you may wish to capture the location information at the Account, Customer, or Ticket entity level. In our example, we will capture the location information at the Ticket level, to capture the location where the individual support ticket is being submitted from.
The first thing we will do is log into the Service Desk and add three custom Ticket fields. Under the Setup tab…Customization… Customize Fields, we select Ticket Fields and click the New Field button, and add the following fields:
- Address, with Field Type: Text Field, and Field Size: 100 characters wide
- Latitude, with Field Type: Text Field, and Field Size: 15 characters wide
- Longitude, with Field Type: Text Field, and Field Size: 15 characters wide
If desired, we can make the Latitude and Longitude fields ‘Internal’, such that they will not appear to the user in the ticket submission page of the portal. Note that we do not have the ability to specify decimal field types, and as a result, we will use ‘Field Type: Text Field’ for Latitude and Longitude.
When the user submits a ticket via the Support Portal, they will now be prompted to supply an address:
As an alternate approach for collecting the ticket location, we could include custom JavaScript within one of our Portal files, and make use of the W3C Geolocation API to auto-populate the Latitude and Longitude fields based on the user’s detected location.
Creating a Custom Ticket Widget for the Service Desk
We will now log back into the Service Desk, and create a Custom Service Desk Widget, to allow CSRs to view the location of the ticket on a Bing Map.
Custom Service Desk Widgets can be used to pull contextual data about your Tickets, Customers, or Accounts and insert them into a special frame in the Ticket or Account details page. We will create a custom Ticket Widget by navigating to the Setup Tab… Customization…Customize Service Desk…Service Desk Widgets, and selecting the New Service Desk Widget button. We create a widget of Type: JavaScript, and Service Desk Location of Ticket filling out the remainder of the fields like so:
We will now review the HTML and JavaScript source of our widget. We start by:
- including our Map div tag, with appropriate dimensions to match our widget properties
- linking to the Bing Maps AJAX v7 map control over HTTPS
- instantiating a series of JavaScript variables that will be used in our ticket, including the URLs of icons you wish to use for current ticket, and other tickets
- in the sample code below, both of these images are assumed to be 16x16px
- ensure your ticket icons are being requested over HTTPS. You can host your ticket images in the Service Desk Downloads module, if desired
- populating a series of variables with values specific to your implementation
- Important Note: you must update these placeholders with values specific to your Parature department and your Bing Maps Key. To determine the Field Ids of your custom fields such as Latitude, Longitude, Address, and other custom required fields, you can make a Ticket Schema request via the Parature REST API, using a request like so from a browser when logged into the Service Desk:
https://demo.parature.com/api/v1/<accountId>/<deptId>/Ticket/schema - In this example, the only custom required fields for the Ticket entity are Latitude, Longitude, Address, Summary and Description. If your implementation has additional custom fields, you will need to also include these here, and in the Ticket Update code further below:
- Important Note: you must update these placeholders with values specific to your Parature department and your Bing Maps Key. To determine the Field Ids of your custom fields such as Latitude, Longitude, Address, and other custom required fields, you can make a Ticket Schema request via the Parature REST API, using a request like so from a browser when logged into the Service Desk:
<div id='myMap' style="position:relative; width:580px; height:380px;"></div>
<script type="text/javascript" src="https://ecn.dev.virtualearth.net/mapcontrol/mapcontrol.ashx?v=7.0&s=1"></script>
<script type="text/javascript">
    var map = null;
    // location-specific ticket data:
    var thisTicketLat, thisTicketLon, thisTicketAddress;
    // other custom required fields:
    var thisTicketCustomer, thisTicketSummary, thisTicketDetails;
    var thisCustomerTickets = new Array();
var infobox;
var bingMapsKey = "Your Bing Maps Key";
    var thisTicketIcon = "https://YourCurrentTicketIconPath.png";
    var otherTicketsIcon = "https://YourOtherTicketIconPath.png ";

    // Custom Field IDs for Latitude and Longitude fields
    //  as strings; unique to your Parature Department, retrievable via Schema:
    var custFieldIdLat = "YourCustomLatFieldId";
    var custFieldIdLon = "YourCustomLonFieldId ";
    var custFieldIdAddress = "YourCustomAddressFieldId";
    var custFieldIdSummary = "YourCustomSummaryFieldId";
    var custFieldIdDetails = "YourCustomDetailsFieldId";
…
Next, we will use the Parature REST API to retrieve our specific ticket by ID, to obtain the properties of the ticket being viewed. Note that Service Desk Widgets already have access to jQuery, as well as to an API.Parature object, containing the Id of the ticket being viewed, and the stem for the API request URL. Our code will:
- build a Parature REST API request to retrieve the details of the ticket being viewed
- issue the request via the jQuery.getJSON() method
- retrieve fields from the response, including Latitude, Longitude, Address, and any other custom, required fields (needed for update operations)
- check for existing valid Latitude and Longitude properties, and if available, call our getMap() function to show a map
- if valid Latitude and Longitude properties are not available, but an address is, attempt to geocode the address with our geocodeAddress() method; otherwise, show an error message
// Retrieve details of this ticket:
var ticketRequest = API.Parature.apiStem + "Ticket/" + API.Parature.objectId +
    "?_output_=json&_fields_=" + custFieldIdLat + "," + custFieldIdLon + "," + custFieldIdAddress;
$.getJSON(ticketRequest)

.done(function (ticketData) {
    // Retrieve custom fields related to location:
    thisTicketLat = ticketData.Ticket.Custom_Field.filter(
        function (field) {
            // retrieve value of Latitude custom field
            return (field["@id"] === custFieldIdLat);
        }
    )[0]["#text"];
    thisTicketLon = ticketData.Ticket.Custom_Field.filter(
        function (field) {
            // retrieve value of Longitude custom field
            return (field["@id"] === custFieldIdLon);
        }
    )[0]["#text"];
    thisTicketAddress = ticketData.Ticket.Custom_Field.filter(
        function (field) {
            // retrieve value of Longitude custom field
            return (field["@id"] === custFieldIdAddress);
        }
    )[0]["#text"];

    // retrieve the necessary required field data to perform an update, if necessary:
    thisTicketSummary = ticketData.Ticket.Custom_Field.filter(
        function (field) {
            // retrieve value of Summary custom field
            return (field["@id"] === custFieldIdSummary);
        }
    )[0]["#text"];
    thisTicketDetails = ticketData.Ticket.Custom_Field.filter(
        function (field) {
            // retrieve value of Details custom field
            return (field["@id"] === custFieldIdDetails);
        }
    )[0]["#text"];
    thisTicketCustomer = ticketData.Ticket.Ticket_Customer.Customer["@id"];

    // If we have valid coordinates, show a map of the ticket location:
    if (isLatLonValid(thisTicketLat, thisTicketLon)) {
        // instantiate map with approriate lat/long/zoom factor:
        getMap(thisTicketLat, thisTicketLon, 12);

    } else {
        // The ticket does not have valid coordinates, but
        //  if an address exists, we attempt to obtain them
        if (thisTicketAddress && thisTicketAddress != "") {
            geocodeAddress(thisTicketAddress);

        } else {
            // We have no location information for this ticket, and no ticket address
            //  so we show an error message:
            showError("No location data available for this ticket.");
        }
    }

});
…
Showing Our Ticket on the Map
When we have valid Latitude and Longitude values, we will call our getMap() function, which will:
- instantiate a map with the Bing Map AJAX v7 map control, centered on the ticket location
- extend the Pushpin class to allow setting of title and description, which we can use to show details of other tickets
- add a Pushpin, to show the location of this ticket
- optionally, we can also call another function which will populate other data, such as past tickets form the same customer (the code download includes this code as well)
// display bing map:
function getMap(startLat,startLon,startZoom) {
    map = new Microsoft.Maps.Map(document.getElementById('myMap'),
        { credentials: bingMapsKey, zoom: 12, center: new Microsoft.Maps.Location(thisTicketLat, thisTicketLon) });
    // extend the pushpin class to store information for infobox:
    Microsoft.Maps.Pushpin.prototype.title = null;
    Microsoft.Maps.Pushpin.prototype.description = null;

    // show a pushpin of the ticket:
    var pushpinOptions = { icon: thisTicketIcon, width: 16, height: 16, zIndex: 500 };
    var pushpin = new Microsoft.Maps.Pushpin(new Microsoft.Maps.Location(thisTicketLat, thisTicketLon), pushpinOptions);
    map.entities.push(pushpin);

    // get remainder of tickets, based on customer ID:
    getCustomerTickets(thisTicketCustomer);
}…
Our geocodeAddress() function, which we call when we have an address, but no existing Latitude and Longitude, will:
- build a Bing Maps REST Locations API request, including the address
- note that we use the Bing Maps key directly, as opposed to session credentials from a Bing Map, as we do not know if we will need to show a map at this stage
- issue the request via the jQuery.getJSON() method
- if we obtain a geocoding result:
- we take the Latitude and Longitude of the first result returned, and display our map
- we also call a function that will update the ticket with the coordinates, to avoid re-geocoding in the future
function geocodeAddress(address) {
    // Call geocoding service. Note that we will use the Bing Maps key directly,
    //  as we do not have a map instantiated, and do not know whether we will need
    //  need one, depending on the success of our geocoding request:
    var searchRequest = 'https://dev.virtualearth.net/REST/v1/Locations/' +
    address +
    '?output=json&jsonp=?&key=' + bingMapsKey;
    $.getJSON(searchRequest)
    .done(function (geoData) {
        if (geoData &&
        geoData.resourceSets &&
        geoData.resourceSets.length > 0 &&
        geoData.resourceSets[0].resources &&
        geoData.resourceSets[0].resources.length > 0) {

            // We will take the first geocoding result:
            thisTicketLat = Math.round(geoData.resourceSets[0].resources[0].point.coordinates[0] * 100000) / 100000;
            thisTicketLon = Math.round(geoData.resourceSets[0].resources[0].point.coordinates[1] * 100000) / 100000;

            // Show the map:
            getMap(thisTicketLat, thisTicketLon, 12);

            // Update this ticket via the Parature API, so we don't have to
            //  re-geocode the next time the ticket is opened:
            updateTicketCoords();
        } else {
            // Geocoding request failed to return a result
            // Infom user with an error message:
            showError("No location data available for this ticket.");
        }

    });
}
…
To update the ticket with the coordinates obtained from the geocoding request, we use the Parature REST API with a Ticket Update request. To do this, we:
- build a Parature REST API request to update the ticket by ID
- execute the request with the jQuery.ajax() method, in order that we can use the PUT request type required for updates
- pass in XML data, with all required custom fields, including the Latitude and Longitude values
- inform the user of the update once complete
// Update ticket coordinates:
function updateTicketCoords(ticketData) {
    // Build request URL, and execute with jQuery, using PUT method:
    var updateRequest = API.Parature.apiStem + "Ticket/" + API.Parature.objectId + "?_enforceRequiredFields_=false";

    $.ajax({
        type: "PUT",
        url: updateRequest,
        // You will require specific elements to be provided based on your
        //   own department ticket fields:
        data: '<Ticket id="' + API.Parature.objectId + '">' +
                '<Ticket_Customer>' +
                '<Customer id="' + thisTicketCustomer + '"/>' +
                '</Ticket_Customer>' +
                '<Custom_Field id="' + custFieldIdLat + '">' + thisTicketLat + '</Custom_Field>' +
                '<Custom_Field id="' + custFieldIdLon + '">' + thisTicketLon + '</Custom_Field>' +
                '<Custom_Field id="' + custFieldIdSummary + '">' + thisTicketSummary + '</Custom_Field>' +
                '<Custom_Field id="' + custFieldIdDetails + '">' + thisTicketDetails + '</Custom_Field>' +
                '</Ticket>'

        })

        .done(function (msg) {
            alert("Ticket Coordinates updated");
        });
}
…
Our JavaScript also includes some utility methods, to validate numbers and coordinates, as well as showing infoboxes, if needed.
We paste our complete code into the Source textbox of our Service Desk Widget Details form, and click Save.
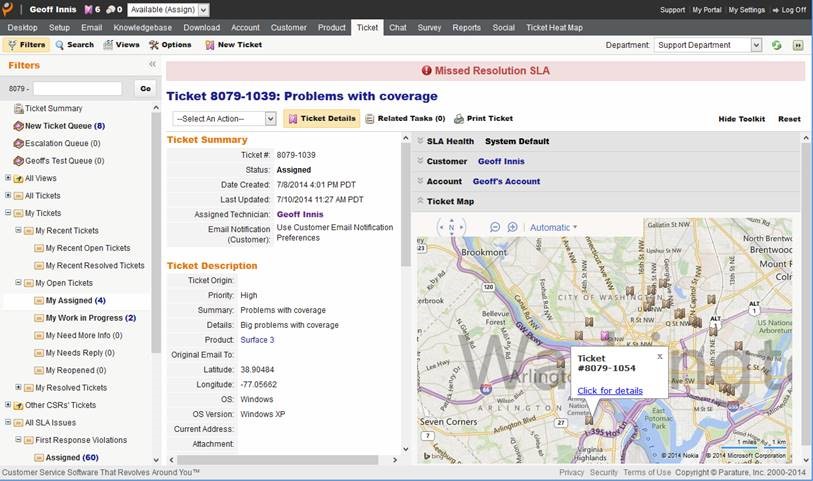
Now, when we open up a ticket in the Service Desk which has either a valid address or Latitude/Longitude populated, we will be able to view a map of the ticket, and any other tickets or data we also retrieved:
Heat Maps of Tickets
Next, we will create a new Custom Service Desk Tab, and we will use it to display heat maps of ticket Views. By visualizing hotspots of ticket activity on a map, we will be able to identify trends in the locations from which tickets that meet specific criteria are originating from, and to derive actionable location-based insight.
Before creating our new Tab, we will retrieve and host the Bing Maps AJAX v7 Heat Map Module within Parature. This module was created by Alastair Aitchison, and is shared on CodePlex as part of the Bing Maps V7 Modules project. This module enables the creation of heat map overlays, with the ability to customize the color gradients, and intensity and radius of hotspots based on an array of locations. Note that this module is dependent on the HTML5 canvas element. For Internet Explorer, this means IE9+ will be needed to view the heat map. The source code for the module can be retrieved, and uploaded to the Parature Downloads module of the Service Desk. See here for instructions on how to load files into the Service Desk Downloads module.
Creating Our Custom Service Desk Tab
To create a new Custom Service Desk Tab, we log into the Service Desk and navigate to Setup…Customization…Customize Service Desk…Service Desk Tabs. We now select New Service Desk Tab. We name our new tab, make it Active, and select a Type of JavaScript:
As with our previous Ticket Widget, we will review the HTML and JavaScript that we will add for our Source. We start the Tab source code by:
- adding with a div to contain the map, which will occupy all available area
- adding a div containing a dropdown, which we will populate with all available Ticket View options
- adding styles to position the dropdown
<div id="myMap" style="position:absolute; width:100%; height:100%;"></div> <div id="selectView"> <form action="#">Select View: <select id="viewselect" onchange="getTickets();"> <option value="all">All Tickets</option> </select> </form> </div> <style type="text/css"> body { margin: 0 0 0 0; } #selectView { position: relative; top: 0px; width: 400px; height: 29px; background-color: #FAF7F5; z-index: 10000; left: 350px; vertical-align: middle; color: #0060c0; font-weight: normal; font-family: Arial; } </style> …
Next, we move onto our JavaScript. In our code, we will start by:
- linking to the Bing Maps AJAX v7 map control over HTTPS
- instantiating a series of JavaScript variables that will be used in retrieving and displaying tickets
- populating a series of variables with values specific to your implementation
- as before, to determine the Field Ids of your custom Latitude and Longitude fields, you can make a Ticket Schema request via the Parature REST API
- note that we also include the location of our heat map module code, which we previously loaded into Parature, over HTTPS
- adding a handler to instantiate our map once the window is fully loaded
<script type="text/javascript" src="https://ecn.dev.virtualearth.net/mapcontrol/mapcontrol.ashx?v=7.0&s=1" ></script >
<script type="text/javascript" >
// instantiate global variables:
var map = null;
var tickets;
var ticketLocations;
var heatmapLayer = null;
var heatmapModuleLoc = "https://<YourHeatMapModuleLocation>";

// Custom Field IDs for Latitude and Longitude fields
//  as strings; unique to your Parature Department:
var custFieldIdLat = "YourCustomLatFieldId ";
var custFieldIdLon = "YourCustomLonFieldId ";

// Add handler to load map when window is loaded:
$(window).on("load", getMap);
…
In our getMap function, we will:
- instantiate our map using our Bing Maps Key
- build a Parature REST API request to retrieve all available Ticket Views
- issue the request via the jQuery.getJSON() method
- add each available view as an option in our view select dropdown
- register and load the heatmap module, specifying a callback function
// Create our map, and populate views:
function getMap() {
    map = new Microsoft.Maps.Map(document.getElementById('myMap'),
        { credentials: 'Your Bing Maps Key' });

    // Retrieve available ticket views:
    var viewRequest = API.Parature.apiStem + "Ticket/view?_output_=json";
    $.getJSON(viewRequest)
            .done(function (data) {
                // for each available ticket view, add it to the view select:
                for (var j = 0; j < data.Entities.View.length; j++) {
                    $('#viewselect').append(new Option(data.Entities.View[j]["Name"]["#text"], data.Entities.View[j]["@id"], false, false));
                }
            });

    // Register and load the Client Side HeatMap Module
    Microsoft.Maps.registerModule("HeatMapModule", heatmapModuleLoc);
    Microsoft.Maps.loadModule("HeatMapModule", {
        callback: getTickets
    });
}
…
In our callback, we will:
- check to see if a heat map has already been generated, and if so, remove it
- build a Parature REST API request to retrieve a list of tickets, including a view parameter, if applicable
- call a function to issue our request, to retrieve the first ‘page’ of our results
// Retrieve all tickets that match our selected view:
function getTickets() {

    // Clear any data first:
    if (heatmapLayer) { removeHeatmapLayer() };

    // Arrays to use for tickets and heatmap locations:
    tickets = new Array();
    ticketLocations = new Array();

    // Build ticket request URL:
    var ticketRequest = API.Parature.apiStem + "Ticket?_output_=json&_fields_=" +
        custFieldIdLat + "," + custFieldIdLon + "&_pageSize_=500&_order_=Date_Created_desc_";

    // Determine selected view, if any, and add to the request URL:
    if ($("#viewselect").val() != "all") {
        ticketRequest += "&_view_=" + $("#viewselect").val();
    }

    // issue request
    issueTicketsRequest(ticketRequest, 1);
}…
Our issueTicketsRequest() function receives two parameters: the ticketRequest URL, and a parameter to indicate which page of results we are seeking, to allow us to paginate through larger data sets of more than 500 tickets. In this function, we:
- issue our request via the jQuery.getJSON() method
- add our ticket results to an array
- determine whether we have all tickets that match our criteria, or whether we need to retrieve more
- when we have retrieved all results, call our displayTickets() function
function issueTicketsRequest(requestUrl, page) {
    $.getJSON(requestUrl + "&_startPage_=" + page)
            .done(function (data) {
                //Add tickets to total results array:
                tickets.push.apply(tickets, data.Entities.Ticket);
                // Check if we have all data:
                if (data.Entities["@total"] > (((+data.Entities["@page"] - 1) * +data.Entities["@page-size"]) + +data.Entities["@results"])) {
                    // We need to retrieve the next page of results:
                    issueTicketsRequest(requestUrl, (+data.Entities["@page"] + 1).toString());
                } else {
                    // We have all tickets, so display them:
                    displayTickets(tickets);
                }
            });
}
…
In our displayTickets() function, we will now display the heat map based on our array of tickets. We do this by:
- retrieving the coordinates from each ticket, and using them to add a Microsoft.Maps.Location to an array of locations
- auto-scale our map to show the best view that encompasses all matching ticket locations
- create and display our heat map layer using the array of ticket locations, and specifying some display options
The heat map module accepts several options when creating the heat map layer, in addition to the map and locations parameters:
- Intensity: a value between 0 and 1 which dictates the central opacity of each heat spot
- Radius: the radius, in pixels, of each heat spot
- Unit: we are specifying a radius in pixels, but it is also possible to specify a radius in meters. By using pixels, we ensure the heat spots will be visible at any zoom factor
- Colour Gradient: specifies which colors to use to represent the hottest, coolest, and intermediate areas
function displayTickets(tickets) {
    // retrieve ticket coordinates:
    for (var j = 0; j < tickets.length; j++) {
        var ticketLat = tickets[j].Custom_Field.filter(
            function (field) {
                // custom field Latitude
                return (field["@id"] === custFieldIdLat);
            }
        )[0]["#text"];
        var ticketLon = tickets[j].Custom_Field.filter(
            function (field) {
                // custom field Longitude
                return (field["@id"] === custFieldIdLon);
            }
        )[0]["#text"];
        // if we have valid coordinates, add them to our array:
        if (isLatLonValid(ticketLat, ticketLon)) {
            var location = new Microsoft.Maps.Location(ticketLat, ticketLon);
            ticketLocations.push(location);
        }
    }

    // Set map view from tickets:
    map.setView({ bounds: Microsoft.Maps.LocationRect.fromLocations(ticketLocations) });

    // Construct heatmap layer, using heatmapping JS module:
    heatmapLayer = new HeatMapLayer(
        map,
        [],
        {
            intensity: 0.7,
            radius: 20,
            // We can have our hot spots
            //  dimensioned by pixels or meters:
            unit: 'pixels',
            colourgradient: {
                0.0: 'green',
                0.5: 'yellow',
                1.0: 'red'
            }
        });
    heatmapLayer.SetPoints(ticketLocations);

}…
Our JavaScript also includes some utility methods, to validate numbers and coordinates, as well as removing the heat map, when needed.
We paste our complete code into the Source textbox of our Service Desk Tab Details form, and click Save.
The next time we log back into the Service Desk, we will now have our new Ticket Heat Map tab available to us, and we can view heat maps of our tickets using any ticket views we have created.
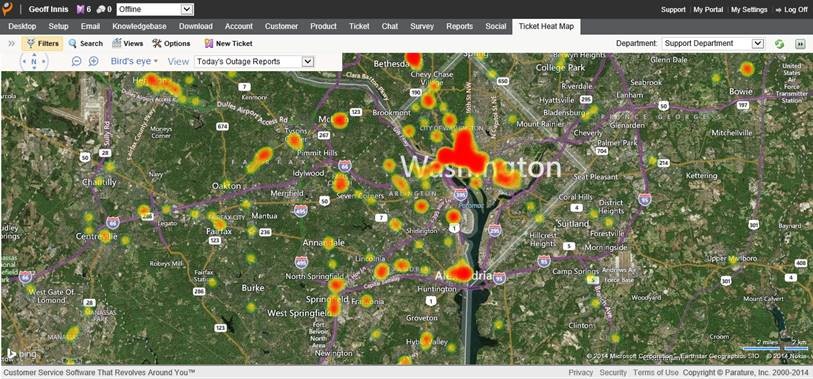
Some scenarios in which heat map visualizations of tickets can be of benefit include understanding the following:
- where we may have infrastructural issues that need addressing, based on the concentration of service issue reports
- which jurisdictions we may need to adapt our constituent outreach programs in
- which geographies or demographic groups our Parature Knowledgebase content may not be serving effectively, and adapting it
The complete code can be found here.
Geoff Innis
Parature Technical Specialist
